
UseWordPress to build a websiteMost people who build websites with WordPress encounter slow loading speeds, and they don't know why WordPress is slow. So they blame WordPress for being bloated and switch to lightweight blogging systems like Typecho.
So Naiba recommends aWordPress Plugin: Query Monitor
Query Monitor plugin introduction
Query Monitor is a developer tools panel for WordPress. It supports debugging database queries, PHP errors, hooks and actions, block editor blocks, enqueued scripts and stylesheets, HTTP API calls, and more.
It includes advanced features such as debugging Ajax calls, REST API calls, and user capability checks. It can minimize most of its output via plugins or themes, allowing you to quickly identify poorly performing plugins, themes, or functions.
Query Monitor focuses on presenting information in a useful way, such as displaying aggregated database queries grouped by the plugin, theme, or function responsible for them. It adds an admin toolbar menu showing an overview of the current page, and once you select the menu item, full debug information is displayed in a panel.
The above is from the official Query Monitor introduction. For ordinary users, it might be a bit unclear, so Naiba will demonstrate how to use Query Monitor below.
Using Query Monitor
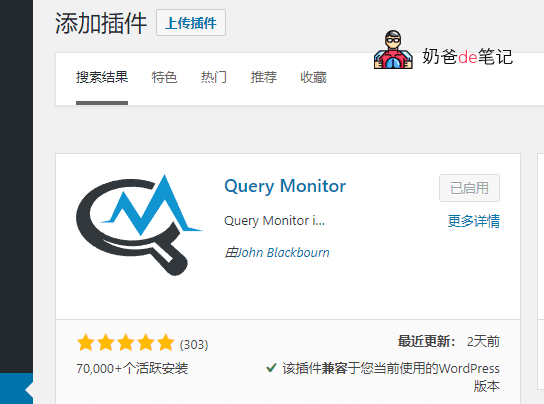
First, from theWordPressbackend, install and activate Query Monitor.
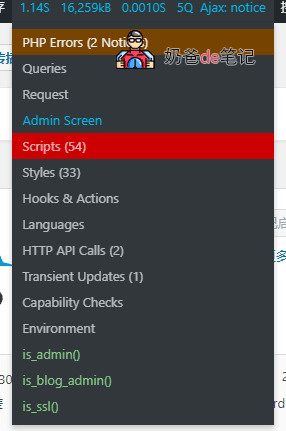
After activation, you will see an indicator bar like the one in the image below added to the top admin bar.

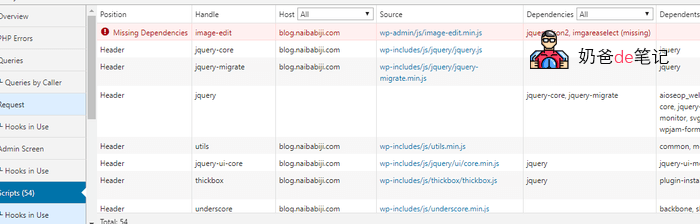
If the indicator bar is red, it indicates there are errors on the webpage. Hover your mouse over it, and the error content will be highlighted in red. Click into it to view details, and you can troubleshoot where the problem lies.
Of course, judging this error still requires some discernment. For example, Naiba's error report seems to be related to image editing, because Naiba has installed theUpyunplugin, which has taken over the media library function. So the error is likely from here and can be ignored.
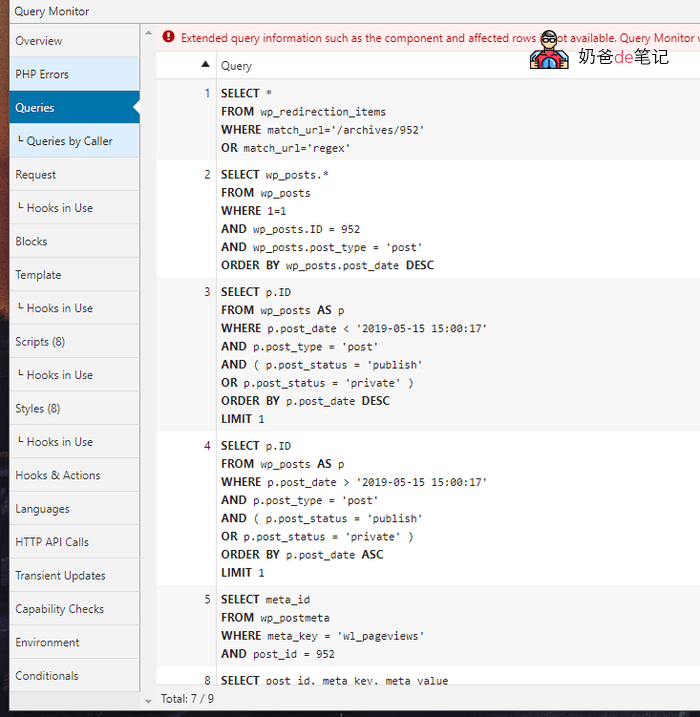
Typically, when weWordPress optimizationoptimize WordPress, we use caching plugins for page caching, then optimize and cache database queries. In the Query Monitor Overview interface, you can see the number of database queries.
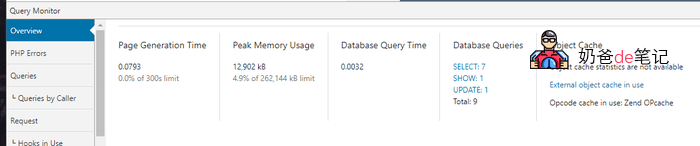
Naiba's page made a total of 9 database queries. From the details page, you can roughly see which queries can be eliminated. Just delete the corresponding plugins.
Of course, for novice users, optimizing WordPress may still be challenging. Naiba's most direct advice is to choose a simple theme, avoid adding too many features, and only install necessary plugins.
Then install WP Super Cache, set up Memcached cache on the server, and then add aUpyun's free CDN to accelerate images. Basically, no further optimization is needed; it will already be very fast.
Query Monitor Download Link
If you are using a foreign server, you can directly search for Query Monitor in the WordPress backend plugin repository and install it.
If you are using a domestic server, you can download it from the link below and upload it to the website backend for installation.